Skip to Main Content

SCOTUS Mapper Library: Home

Welcome to the SCOTUS Mapping Project Library


This is the LIBRARY HOME for the Supreme Court Mapping Project. Tabs in the library link to map galleries of different Supreme Court doctrines. Maps faciliate research and learning about Supreme Court jurisprudence by showing relationships between Court opinions. Maps can usefully illustrate lines of Supreme Court opinions.

The Supreme Court Mapping Project proudly works in collaboration with Free Law Project. Now anyone can create basic networks online with the Supreme Court Citation Network tool. If you create a network map with and would like it to appear in this library, please let us know. Advanced users who want to create more complex maps can contact us to get free access to the desktop version of the software.

Two Software Platforms and Different SCOTUS Maps: A Brief Explainer

Since 2012, the SCOTUS Mapper Project has developed various types of doctrinal maps using two software platforms. The first platform runs as a stand-alone on a user's desktop. Launched in February 2016, the second online platform is a collaboration with Free Law Project. For an hour-long video explaining how the new tool works, see this video.

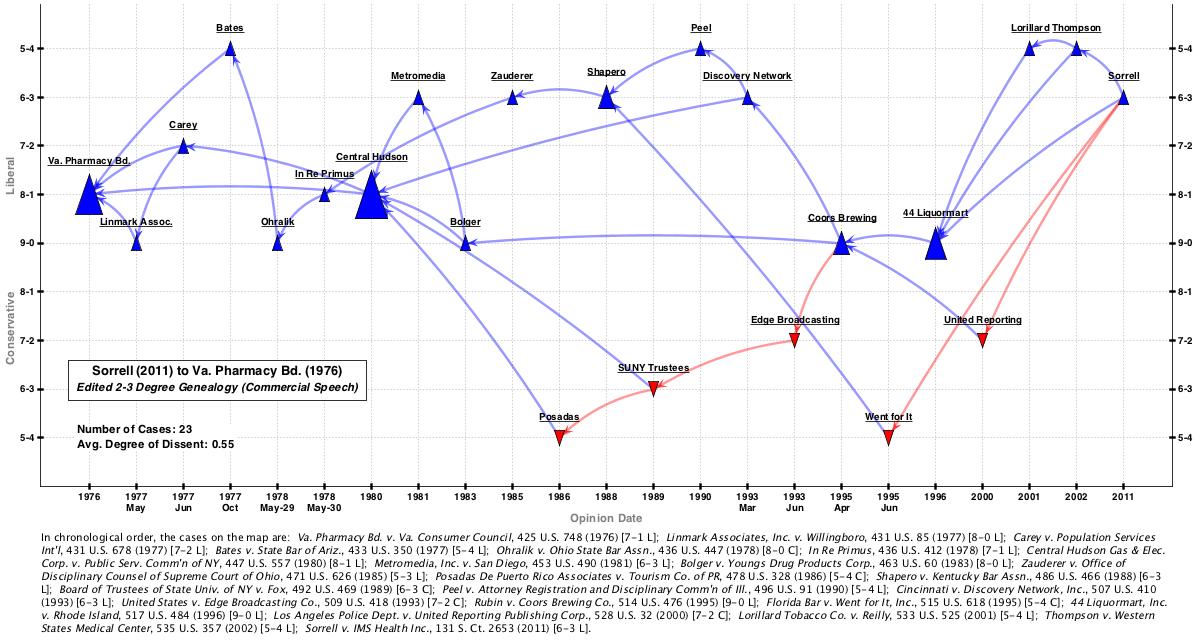
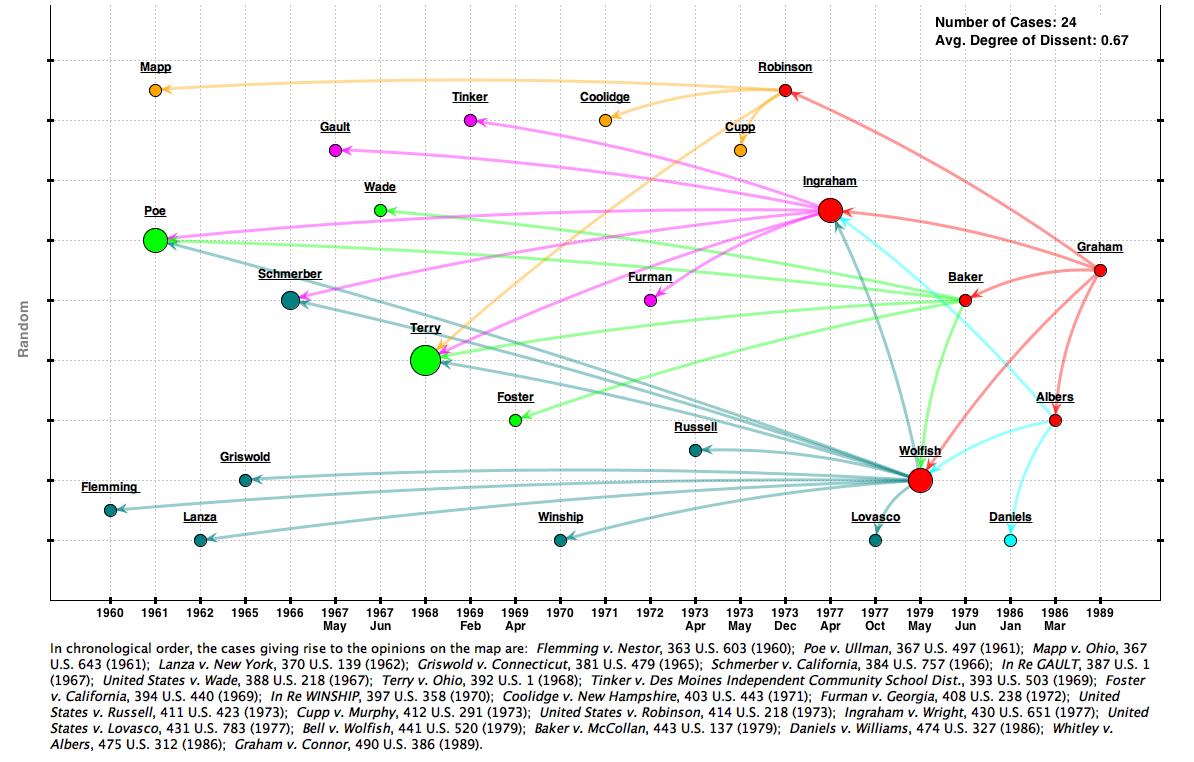
All maps plot Court cases or opinions on an X-Y access. The X axis always represents the date of an opinion/case. All maps show relationships between opinions/cases using arrows. In most maps, arrows indicate that one opinion/case cites another. Thus, most maps represent citation networks.  Different SCOTUS maps include:

  • Standard Opinion. In standard opinion maps, the Y-axis represents the number of votes an opinion received. This kind of map can separately display majority, dissents, and concurring opinions. Note that standard opinion maps can only be created with the desktop software (not available online)
  • Citation Degrees (Spread). In citation degrees maps, relationships between cases (not opinions) are shown to n-degrees of citation connection. These kinds of maps are automatically generated by the desktop and online software by querying the CourtListener database. Note that online, these maps have a designated chart type of "Spread". In citation degrees maps, the Y axis has no substantive signficance.
  • Spaeth (Supreme Court Database). In Spaeth maps, data from the Supreme Court Database (aka Spaeth) is represented in the citation network. The Y-axis represents the Spaeth coding for vote for outcome (9-0, 8-1, etc) as decision direction ("liberal" or "conservative" per Spaeth). These maps are also automatically generated by the online and desktop software.
  • Spaeth Genealogy. Spaeth genealogy maps look essentially the same as Spaeth maps. The difference is that genealogy maps have been cleaned by an alogorithm that reveals direct lines connecting generations of cases. For certain dense networks, this view is much easier to work with to uncover competing lines of cases. Note that Spaeth genealogy maps can only be created with the desktop software (not available online).  

Galleries contain maps of all the different types above. If you are unsure what kind of map you're looking at, look at the Y-axis and read the labels! For more detailed map explanations with links to videos and scholarly articles, check out the Resources tab.